Lease data rendered for your
financial planning and forecasting
To maintain profitability and grow in challenging markets, executives
and business leaders rely on careful financial planning and cash flow
management.
Corporate finance professionals need to develop financial budgets, provide forecasts, and deliver scenarios for the future with confidence.
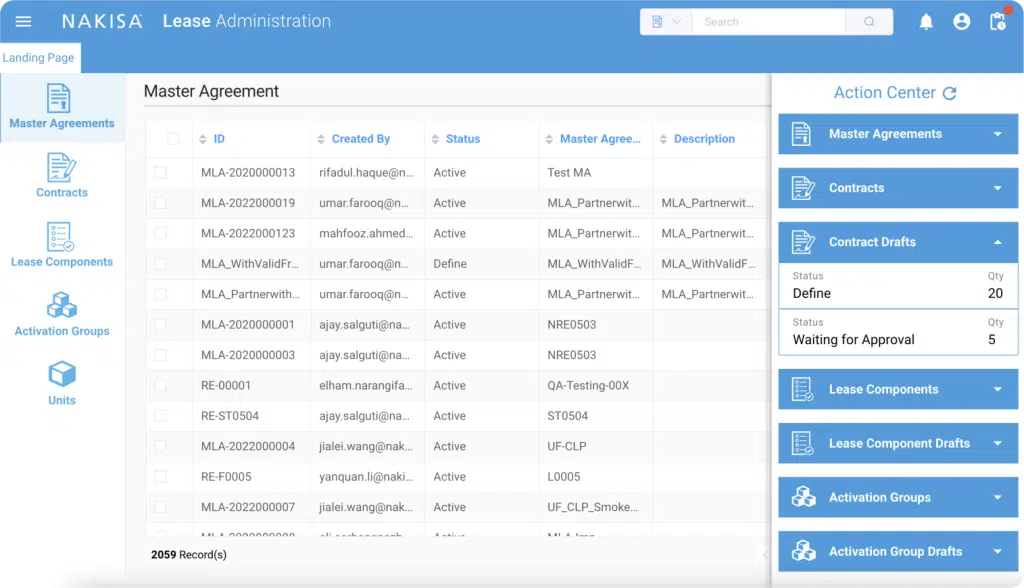
Nakisa Lease Administration already
aggregates and processes all lease data, including assets, liabilities, equity,
accruals, and cash.
The Financial Analysis Reporting Module implements essential dashboards and reports within the solution to support planning and forecasting activities.
Empower the C-suite and board of directors, as well as corporate finance professionals, data or procurement officers, and lease accountants with key information. Keep your company strategy on target to stay competitive and generate more profit.
Essential for FP&A
FP&A teams oversee a broad array of financial activities, including income, expenses, taxes, capital expenditures, investments, and financial statements. The Financial Analysis Reporting Module is the best tool to successfully exploit lease data for FP&A.
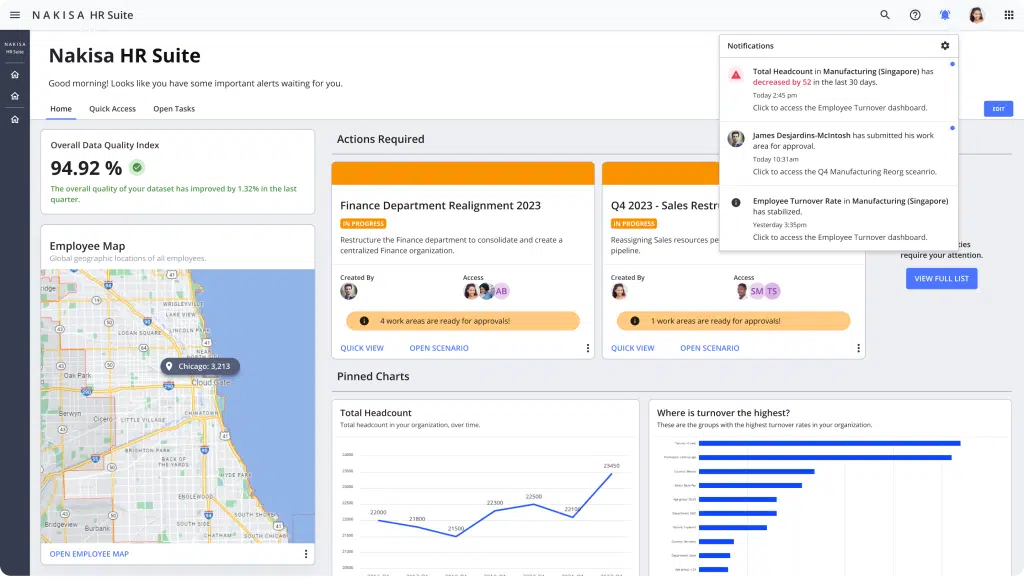
Visualize, customize, save, export, schedule, and share
Once the Financial Analysis Reporting Module is enabled, you will be able to:
Crunch your lease data directly in Nakisa Lease Administration
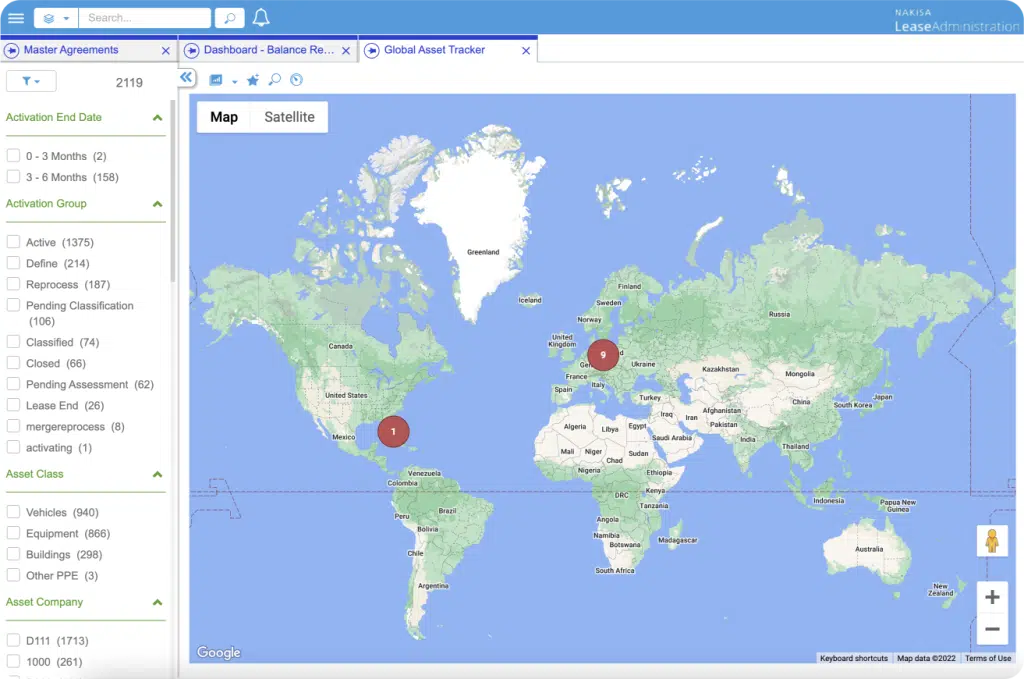
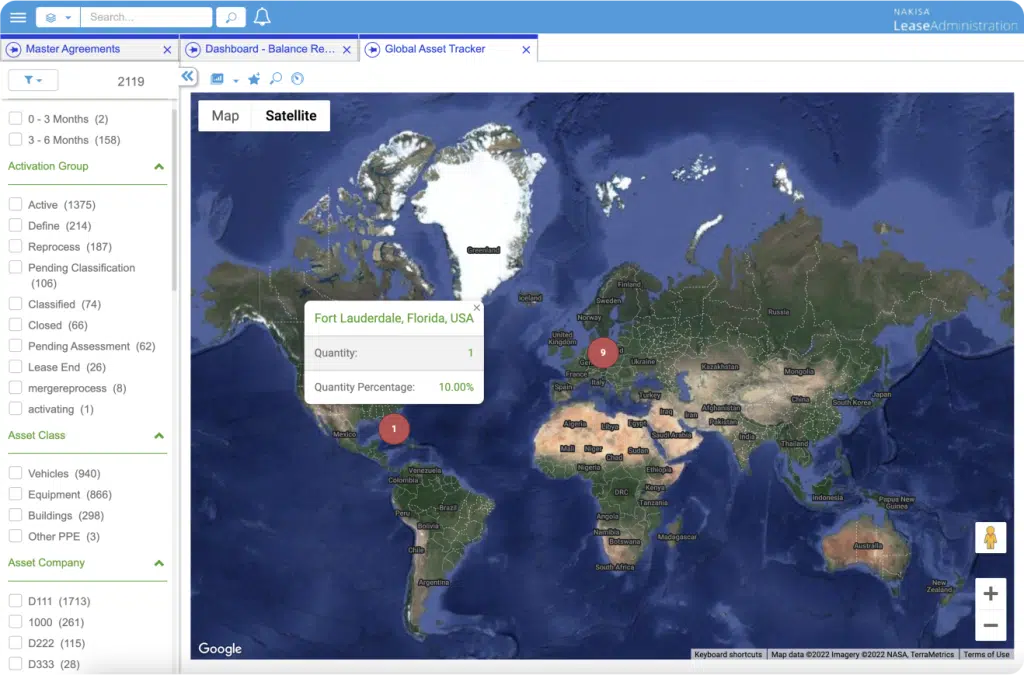
Track live data using dashboards, charts, and reports
Apply filters to identify or limit data inputs
Download Excel-formatted financial statements and schedule report exports
Enhance your business strategy with
compelling reports and dynamic dashboards
To maintain profitability and grow in challenging markets, executives
and business leaders rely on careful financial planning and cash flow
management.
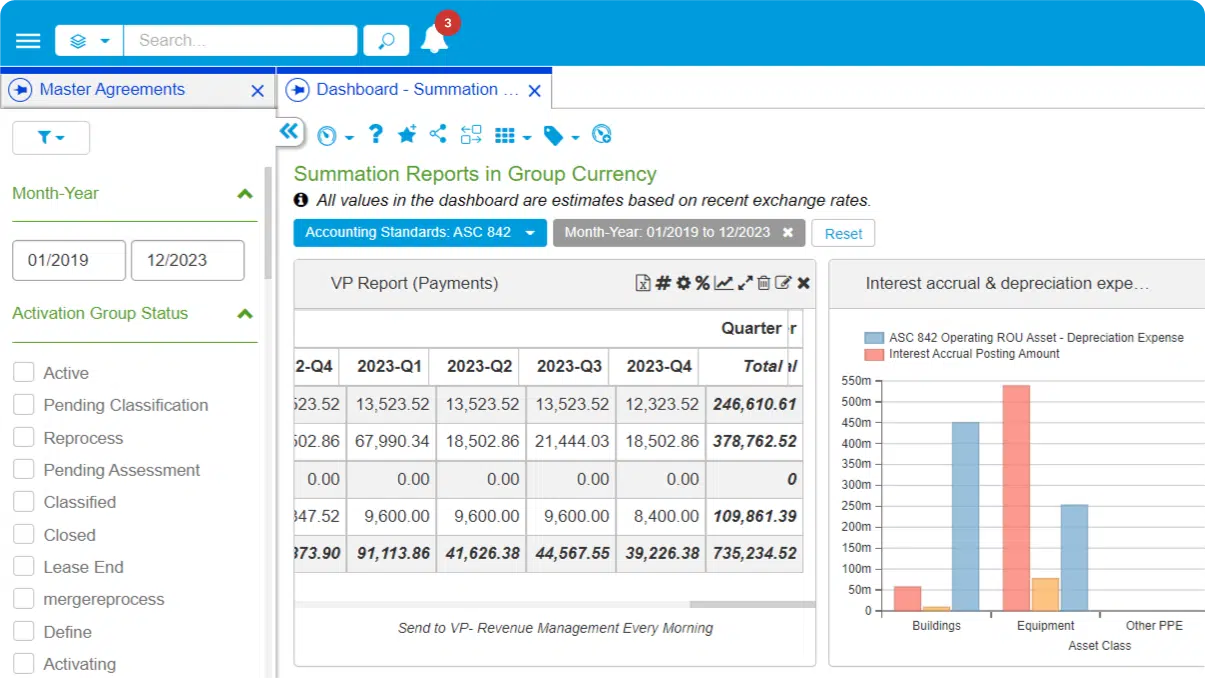
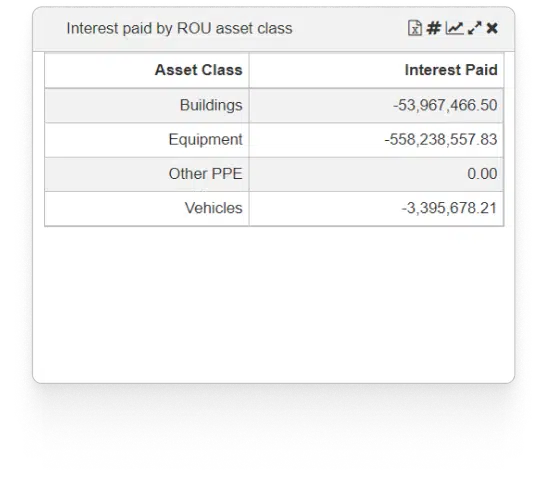
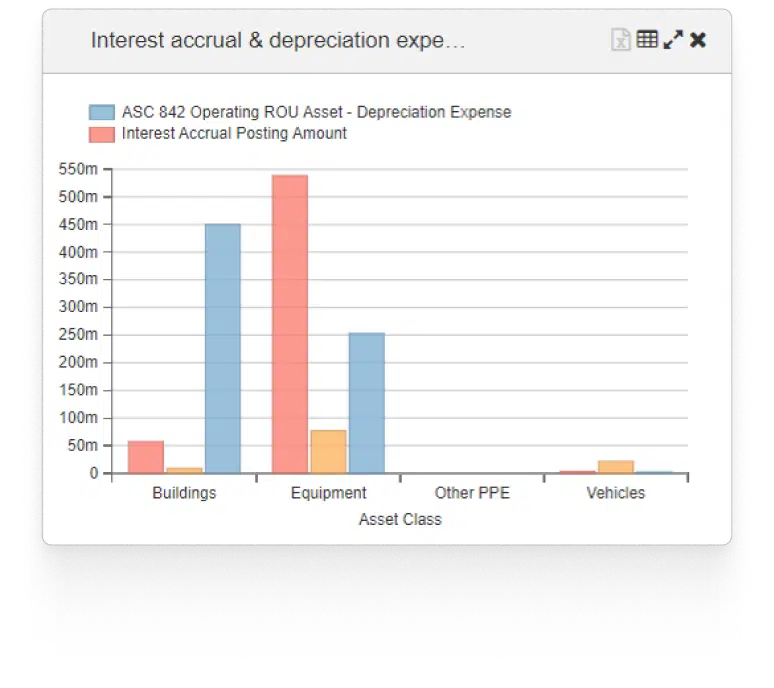
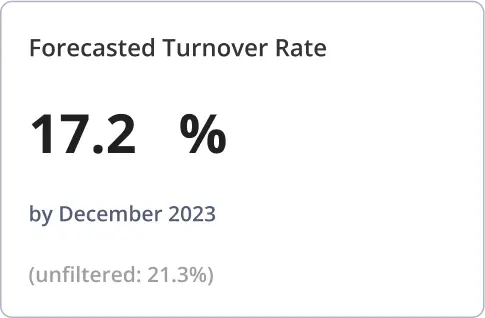
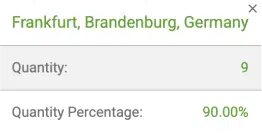
Dynamic and custom dashboards
Generate, visualize, and customize
summation and balance reports. Data
comes in list, chart, graph, or table format.
Pre-set, downloadable Excel reports
Customize, generate, and download
income statements, balance sheets, and
cash flow statements in Excel format.
Want help from a Financial
Planning & Analysis expert?
Don’t hesitate, we are here for you! Tell us more about your goals.